Explored by:
Aubrey D. Johnson
A parabola is a plane curve generated by a point moving so that its distance from a fixed point is equal to its distance from a fixed line : the intersection of a right circular cone with a plane parallel to an element of the cone according to Webster.com.
This the basic parabola function:

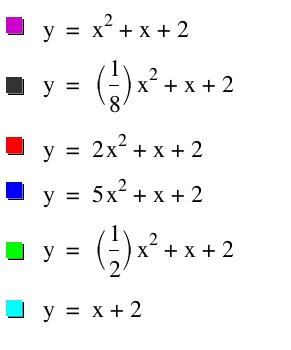
Where a, b and c are coefficients and a can not = 0, other wise this quadratic equation becomes a linear equation. This type of equation is known as a quadratic equation because because quadratus is Latin for "square"; in the leading term the variable is squared (according to Wikipedia.com). The leading coefficient is a, b is also a coefficient, c is better known as the constant term. For our purposes we will b = 1 and c = 2. We are going to investigate the effects of altering a.
First, let us start with a basic quadratic equation, with a = 1.
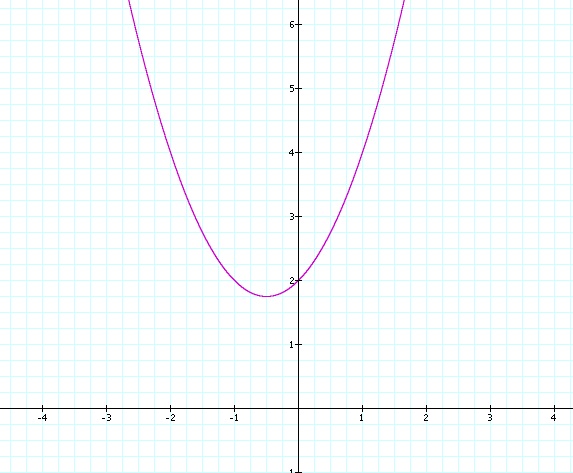
So now we can see what we are starting with and compare this to any and alterations that we will make to determine the significance of the leading coefficient.
Now as stated earlier, a can not equal 0, other wise this quadratic equation will turn into a linear equation. We should explore this idea to solidify the significance of having a value for a before we move on.


The "zero" was placed in the a position to show emphasis, anything time 0 is 0, so it really does not need to be shown and should look like the equation tot he right of the two equations.
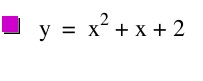
Let us see what happens when we take a from 1 to 2.


It would appear that the "a" coefficient controls the width of the graph. We can see this because the red graph is thinner than the pink graph. Lets see if "a" makes the graph thinner by setting a=5.

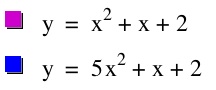
It seems that changing "a" does make the graph thinner, by looking at the blue graph. Even though the blue graph is thinner than the pink graph, they still share a point on the y-axis. This same point is also shared by the red graph from above. Is this a coincidence or is there a reason that these three graphs touch the same point on the y-axis? We will need to make a few more graphic comparisons to see if a pattern does exist. Also, we have apparently made the graph thinner, and it seems to get thinner every time we increase the amount of "a." So, I think we should use a smaller number to make the graph wider. But, we already saw what the graph looks like when a=1 and a=0, so what kind of number should we use that is lager than 0, but smaller than 1? Lets try fractions ....perhaps start with (1/2).
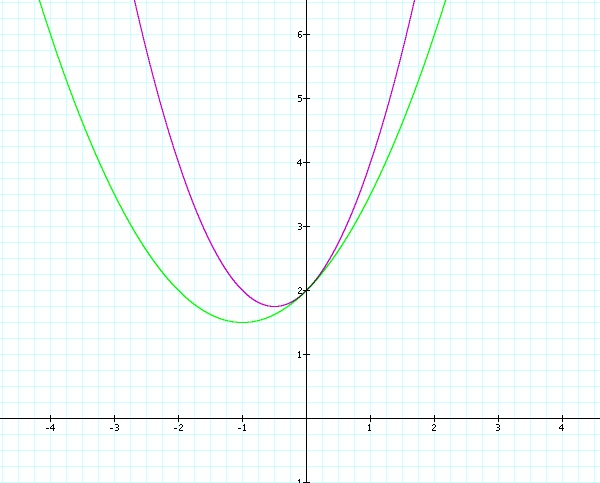

The green graph is definitely wider than the pink graph, but it still hits the y-axis at the same point as the pink graph. We need to fins the significance of y = 2. We will look at one more graph to ensure that "a" controls the width of the overall graph. We should try and make the graph even wider, let us use (1/8).
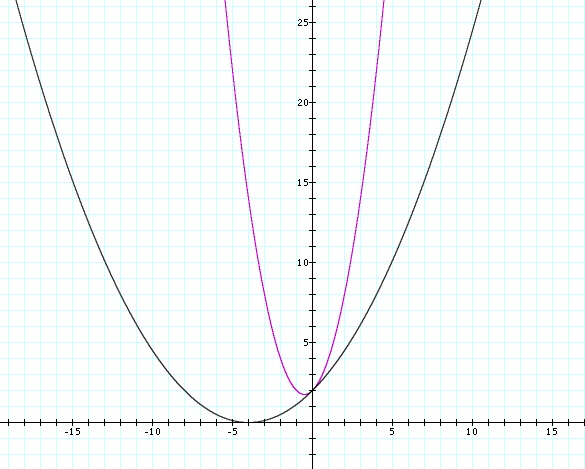

Changing "a" from (1/2) to (1/8) makes the graph wider. But notice still that the black graph crosses the y-axis at the same point as the pink graph, which is the same as the other graphs. This would mean that "c" the constant coefficients tells you the y-intercept of the parabola.
So all of our explored graphs together look like:

Looking at all of our graphs shows that they all do appear to intercept the y-axis at y=2. We also are able to get a better view on how the graphs compare to one another. From the thinnest parabola (red) to the widest (black) and finally to to the strait line (light blue). Let's enlarge the graph at y=2 to see if they all do cross at this point.

Now we can see that all graphs do cross the y-axis at y = 2, which makes mathematical sense. The constant coefficient is constant because it is not altered by a variable. and for our equations c = 2.